Probabilities, magnitude, strength
How much, how soon?
Six millimeters is a quarter of an inch. Experts say if the fault is slipping by four to seven millimeters per year, it's serious. In 200 years, it would amount to more than a yardstick's length. When rock pushes rock that much, something will give.
If it is slipping two millimeters or less per year, experts say the next big shake may be a bit less, delayed another 1,000 years, or even never come. Yet, two millimeters a year x 500 years = 3 feet, rock against rock.
Compare movements of other faults.
 California's San Andreas fault is said to slip anywhere from 6 to 45 millimeters per year.
Some mid 1990's studies attempted to measured the movement between stations by satellite, and decided it was very little. Permanent sites now record data continuously. One station is attached to a 60' vertical steel I-beam. 2009-10 update: CERI spokesman Gary Patterson says experts are now doubting that measuring movement of the New Madrid fault gives useful information, since it is in the middle of a tectonic plate.
Is the fault dying? Is it just decompressing from the weight of old glaciers?
 Eric Calais of Purdue University (photo) stands with a global positioning device that measures its location relative to 24 satellites. He says it can detect ground movement of one millimeter per year. Calais says North America is still decompressing from the weight of glaciers.
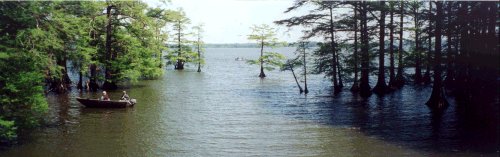
Accurate measurement of rocks moving a few millimeters a year underneath and across the fault, across Reelfoot Lake, is as difficult as it sounds. Freezing and thawing may be a factor. No one knows for sure if such measurements are meaningful in the middle of a tectonic plate...
Reelfoot Lake
Search "Chief Reelfoot" for an interesting lake legend.
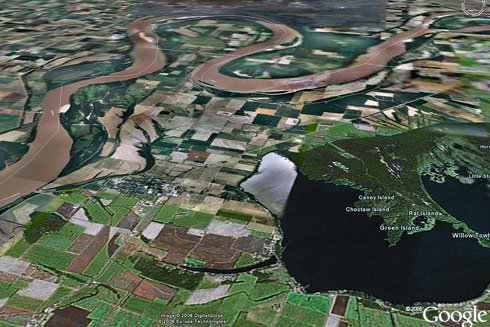 |
Reelfoot Lake is in lower right, formed when the area at left end of lake was raised 15-30 feet by an earthquake uplift (animation). 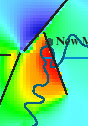 Imagine a line running from west end of the lake, across the river loops. Area to SW uplifted, while other sections lowered. New Madrid at top of loop immediately fell 12 feet in 1812. This created both dams and waterfalls on the Mississippi, temporarily. Red=uplift on left map.
Quakes in centuries prior to 1811-12 probably caused some of the uplift and drop. See research by Margaret Guccione and USGS. The lake area has dropped 1.5 to 6 meters (as much as 20 feet). 1811-12 uplifts & drops
The Lake County uplift, as much as 10 meters (30+ feet), can be subdivided into several bulges, including Tiptonville dome, Ridgely Ridge, and the south end of Sikeston Ridge - from USGS.
Prepare for a six
7 - 10% probability of a repeat of the 1811 - 1812 earthquakes
(magnitude 7.5 - 8.0) - anytime in the next 50 years
25 - 40% probability of a magnitude 6.0 or larger (source)
No longer 90%
The probability for magnitude 6 New Madrid earthquakes a few years ago was put above 90% in 50 years. The USGS changed the figures in 2002 to 25-40% for a magnitude 6.0 or greater and 7 - 10% for a catastrophic event in any 50-year period, based on all new science. The chances for a magnitude 6 were decreased, but chances were slightly increased for the catastrophic events. (news release)
Overdue for a 6
A quake below magnitude four is hardly noticed. A six can do serious local damage. A six happens roughly every hundred years in the New Madrid area. A magnitude 6.8 was centered at Charleston, MO (north end of New Madrid Fault) in 1895, which shook the entire Midwest. [That was 110 years ago! ] PDF report | US shake map.
The fact sheet at http://pubs.usgs.gov/fs/fs-131-02/ has the most current probabilities and scientific justifications.
Metropolitan earthquake damage? In 1811, St. Louis had been incorporated as a town for two years. It had 1,200 people and was built along solid limestone bluffs. The quake cracked a few chimneys there. Its fur-trading founders had wisely chosen not to settle the swampy intersection of the Missouri and Mississippi Rivers, just to the north. Mr. Laclede decided in 1763 where to build his landing (just north of today's landmark arch).
Memphis was still Indian territory in 1811. The "fourth Chickasaw bluff" would not become a town until 1819, and would not have a newspaper until 1826.
The table below was recorded by an engineer in Louisville, Ky, of quakes he felt. He rated each into a category of 1st (highest) to 6th (least felt - people felt something, but may not be certain what it was. The term "giddy" feeling was part of description of #6.
Map of how a big one would shake Kentucky.
Theoretical P-Wave Travel Times from New Madrid
| City | Travel Time (min:secs) |
|---|---|
| St. Louis | 0:36 |
| Knoxville | 0:56 |
| Wichita | 1:32 |
| D.C. | 2:27 |
| Duluth | 2:28 |
| Philadelphia | 2:49 |
| Brownsville | 2:58 |
| Golden | 3:00 |
| New York | 3:03 |
| Miami, | 3:10 |
| Ottawa | 3:14 |
| Albuquerque | 3:16 |
| Boston | 3:37 |
| Seattle | 5:37 |
| Anchorage | 8 |
| Honolulu | 10 |
| London | 10 |
| Rome | 11 |
| Moscow | 13 |
| Beijing | 13 |
| Guam | 14 |
| Nepal | 15 |
| Nairobi | 15 |
| Brisbane | 16 |
These come from an ANSS estimation.
Richter TNT for Seismic Example
Magnitude Energy Yield (approximate)
1.0 - 30 pounds Large Blast at a Construction Site
2.0 - 1 ton Large Quarry or Mine Blast
4.5 - 5,100 tons Average Tornado (total energy)
6.5 - 5 million tons Northridge, CA Quake, 1994
8.0 - 1 billion tons San Francisco, CA Quake, 1906
8.5 - 5 billion tons Anchorage, AK Quake, 1964
12.0 - 160 trillion tons (Fault Earth in half through center,
OR Earth's daily receipt of solar energy)
160 trillion tons of dynamite is a frightening yield of energy. Consider, however, that the Earth receives that amount in sunlight every day.
http://www.seismo.unr.edu/ftp/pub/louie/class/100/magnitude.html
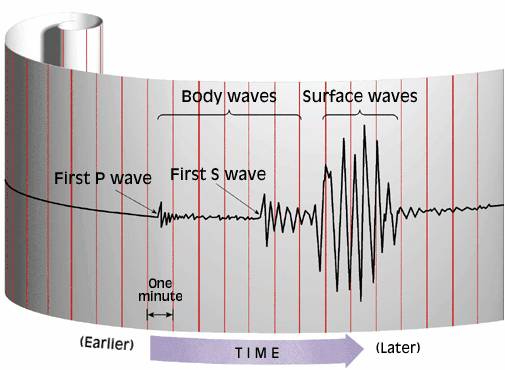
 P-wave
P waves move in a compressional motion like a slinky, while the S waves move in a shear motion perpendicular to the direction the wave is travelling. There are also Love waves and Raleigh waves. P-waves come first, and animals may be more aware of them than humans are. Raleigh waves are the strongest, sometimes called ground roll.
 S-wave
P-waves do not travel beyond 90 km (wikipedia).
A quick way to determine the distance from a location to the origin of a seismic wave less than 200 km away is to take the difference in arrival time of the P wave and the S wave in seconds and multiply by 8 kilometers per second.
China quake waves felt around the globe
Seismic waves caused by a May 2008 massive earthquake in Sichuan Province, China, twice reverberated around the surface of the Earth, according to the Meteorological Agency's Matsumoto Seismological Observatory.
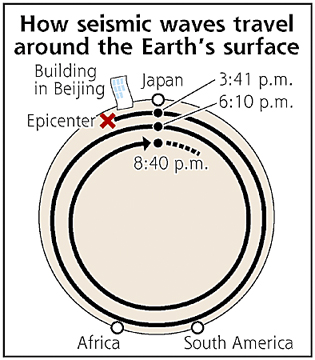
According to the observatory, usually only earthquakes measuring magnitude 8 or higher cause such a phenomenon. However, the latest earthquake, which the agency reported measured magnitude 7.9 on the open-ended Richter scale, was powerful enough to make this happen, the observatory said.
It said waves caused by the earthquake jolted buildings in Beijing, a long way from the epicenter of the temblor.
According to the observatory, the earthquake struck at 3:28 p.m. Japan time Monday. The observatory's seismograph detected seismic waves that lasted for about two minutes at 3:41 p.m., after recording ordinary waves below the Earth's surface.
These long-lasting seismic waves travel between the surface of the Earth and about 100 kilometers deep. The observatory's seismograph recorded these waves again at about 6:10 p.m. and later at about 8:40 p.m. The observatory said the waves reached Japan, traveled to South America and Africa, and returned to Japan again.
www.yomiuri.co.jp
 One
One